
Decisions backed by data your team actually trusts.
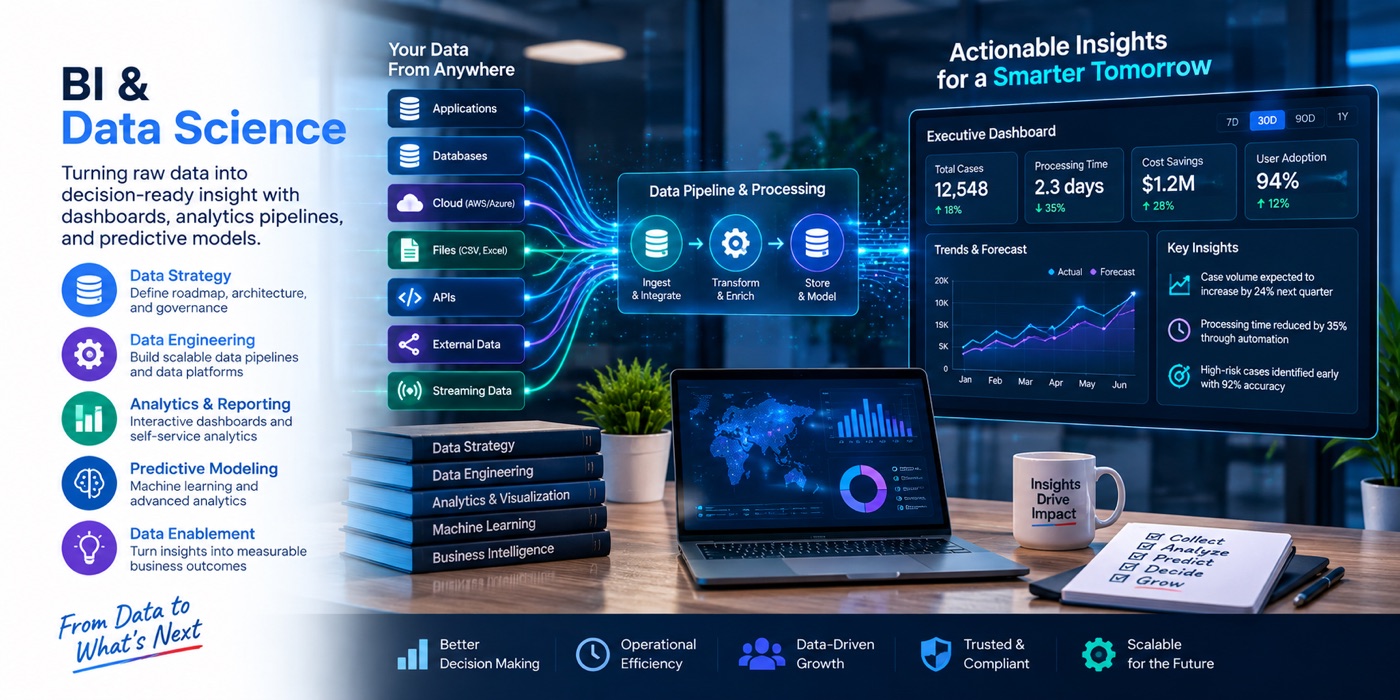
ProSer Insights builds the data pipelines, warehouses, and governed dashboards that turn operational systems into answers — and the applied data science on top: forecasting, segmentation, anomaly detection, embedded analytics. We work in your stack — PostgreSQL, Snowflake, BigQuery, Power BI, Tableau, Metabase — and hand over documented, tested, owned data products.
Built for leaders who are done arguing about whose spreadsheet is right.
Most reporting problems are data problems in disguise — inconsistent definitions, manual extracts, and nobody owning the number. We fix the plumbing and the definitions, then build the analytics. We work with three kinds of teams.
Operations and finance leaders
running the business from exported spreadsheets, who need one governed set of KPIs, refreshed automatically, with drill-down to the record.
Product companies embedding analytics
who want dashboards, forecasts, or recommendations inside their own product — built by engineers who also work in the product's stack.
Agencies and contractors with reporting mandates
that must produce federal and state compliance reports — workforce, health, grant, and program reporting — accurately, on schedule, with an audit trail.
From raw systems to governed answers — and models where they pay off.
Two groups of services. Each ends with a concrete deliverable: a pipeline that runs, a dashboard people open, a model with a measured accuracy.
Data & BI
Data engineering & pipelines
Ingestion from databases, SaaS APIs, files, and event streams; transformation with dbt or SQL; orchestration, testing, and alerting so a broken pipeline is known before the morning meeting.
Deliverable
Documented pipelines under version control with data tests and failure alerting.
Warehouse & data modeling
Dimensional and metrics-layer modeling in PostgreSQL, Snowflake, BigQuery, or Redshift — with definitions the business has agreed to, so 'active customer' means one thing everywhere.
Deliverable
Modeled warehouse, metrics dictionary, and lineage documentation.
Dashboards & reporting
Executive KPI packs, operational dashboards, and scheduled reports in Power BI, Tableau, Metabase, Looker, or embedded in your application — designed for the decision they support, not the chart catalogue.
Deliverable
Dashboards in production with role-based access, training, and a maintenance guide.
Data governance & quality
Ownership, definitions, access controls, quality rules and monitoring, retention, and the compliance reporting controls (validation, reconciliation, sign-off) regulated programs require.
Deliverable
Governance framework, data-quality dashboard, and reporting control evidence.
Data science
Forecasting & planning
Demand, volume, revenue, staffing, and capacity forecasts with confidence intervals, back-tested against history and refreshed on schedule — feeding planning tools people already use.
Deliverable
Forecast model with measured accuracy, scheduled scoring, and a planning view.
Customer & segment analytics
Segmentation, churn and conversion propensity, lifetime value, and cohort analysis — with the 'so what' written for the team that will act on it.
Deliverable
Segment model, scoring pipeline, and an action playbook per segment.
Anomaly & risk detection
Detection of unusual transactions, volumes, timesheet patterns, data-quality breaks, or process exceptions — tuned to your tolerance for false alarms and routed to the right queue.
Deliverable
Detection model with alert routing, thresholds, and a review workflow.
Embedded analytics & ML features
Dashboards, scores, and recommendations delivered inside your product or workflow — a recruiter's queue, a case worker's screen — built with our AI applications team.
Deliverable
In-product analytics or ML feature with monitoring and a retraining plan.
Data engineers who ship the product too. Analysts who understand the mandate.
- 1
Compliance reporting is a specialty, not an afterthought.
We have designed reporting for public-sector programs — federal workforce reports (PIRL-style participant records, quarterly performance), exception and validation reports, audit trails — where the report is the deliverable the funder evaluates.
- 2
We build in the product's stack.
The same engineers who build React/NestJS/PostgreSQL applications build your pipelines and embedded analytics, so analytics live where the work happens instead of in a separate tool nobody opens.
- 3
Open tooling first.
PostgreSQL, dbt, Metabase, Python, and open formats where they fit; commercial platforms where you have them. No proprietary layer you cannot leave.
- 4
US and India delivery, one accountable lead.
A US-based analytics lead owns definitions, stakeholders, and delivery; the India team builds pipelines and dashboards around the clock, so a metric requested at 5 pm is ready the next morning.
Your stack, or a lean one we recommend.
- Warehouses & databases — PostgreSQL, Snowflake, BigQuery, Redshift, SQL Server, Azure Synapse.
- Pipelines & modeling — dbt, Airflow/Dagster, Fivetran/Airbyte, Python, SQL; Power Query where it already exists.
- BI & visualization — Power BI, Tableau, Metabase, Looker Studio, embedded charts in React applications.
- Data science — Python (pandas, scikit-learn, Prophet, statsmodels), notebooks to production jobs, model monitoring.
From KPI definitions to a data platform your team runs.
Definitions come first, plumbing second, dashboards third — because a fast dashboard of a disputed number makes the argument louder.
Foundation
Week 0–1
Discovery & KPI definitions
Decisions to support, metrics and their definitions, owners, and the reports that must go out.
Week 1–3
Source audit & data model
Systems, access, quality, and gaps; dimensional model and metrics layer designed.
Week 3–6
Pipelines & warehouse
Ingestion, transformation, tests, and orchestration built; historical loads reconciled.
Week 4–8
Dashboards & reports
KPI packs and operational dashboards built with users, iterated weekly.
Analytics
Gate
Validation with owners
Numbers reconciled to source systems and signed off by the business owner of each metric.
Sprints
Data science pilots
Forecasting or detection pilots on the modeled data, back-tested and reviewed.
Rollout
Governance & training
Access, definitions, quality monitoring, and training for analysts and consumers.
Ongoing
Handover & support
Documentation, runbooks, and a support retainer or a full handover to your team.
Priced for what you need answered.
Fixed-scope analytics project
A defined set of sources, a warehouse or model, and a KPI pack or compliance report — delivered in 8–12 weeks for a fixed fee.
Best for: one reporting problem solved properly.
Scope a projectRetained data team
Analytics lead, data engineers, and BI developers on a monthly retainer, running your data platform and a backlog you control.
Best for: organizations building a data capability without hiring one first.
Talk about a teamStaff augmentation
Data engineers, BI developers, analysts, and data scientists placed with your team, onshore or offshore, through our staffing practice.
Best for: teams with a platform who need capacity.
Request profilesWhat the work looks like.
State workforce agency · Federal reporting
Participant records, quarterly performance, and validation dashboards
Designed reporting for federal workforce submissions — participant-record extracts, performance measures, and exception and validation reports — with audit trails for program staff.
Staffing platform · Operations analytics
Pipeline and recruiter performance dashboards
Modeled applicant-tracking and placement data and built embedded dashboards inside the recruiting application for managers and recruiters.
Call center · Volume forecasting
Weekly call-volume forecast for AI and human staffing
Built a forecasting model on ProSer VoiceAI and telephony data to plan human agent coverage alongside AI containment.
Questions we get before an analytics project.
Which BI tool should we use?+
The one your people will open. If you have Power BI or Tableau licenses, we build there. If not, Metabase or Looker Studio covers most needs at low cost, and embedded charts in your own application are often better than any BI tool.
Do we own the warehouse and the code?+
Yes. Pipelines, models, dashboards, and documentation live in your accounts and repositories from day one.
Our data quality is poor. Can you still build this?+
Data quality is usually the first deliverable. We profile sources, agree on rules, fix what can be fixed at source, and make the rest visible on a quality dashboard rather than hiding it in a clean-looking chart.
Do we need real-time data?+
Rarely. Most decisions are fine with hourly or daily refresh, which is far cheaper to run. Where a use case needs near-real-time — call-center operations, fraud — we design for it deliberately.
Do we need a data scientist?+
Not to start. Governed KPIs and good dashboards deliver most of the value. When a forecast or a detection model would change a decision, we pilot it on the modeled data and measure it before you invest further.
How is compliance reporting different?+
The report is evaluated by a funder or regulator, so accuracy, validation, reconciliation, and an audit trail matter more than presentation. We build the controls and the evidence alongside the report.
Related services and products
Have a number nobody agrees on?
Tell us what you need to see and where the data lives. Within two business days you will have a source-and-KPI outline, a first-cut data model, and a fixed quote.